Lesson Ideas
Lesson Idea 1: Getting to Know the Data Logger
Introduce the Data Logging Backpack (Data Logger) to your students.
It can be used as a standalone device (as in Lesson 2) or attached to Tuff-Bot (as in Lesson 3).
In this first lesson, after charging it, turn on the Data Logger.
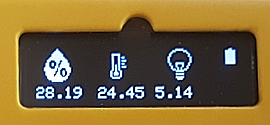
Look at the live data by clicking the green checkmark to see current conditions.
It reports the temperature, humidity, and brightness.
Explain to students what those conditions are and how the Data Logger is reporting them.
- Relative Humidity - this gives the humidity as a value 0–100%
- Temperature - Shows the temperature, based on your unit selection (C or F).
- Brightness - Shows the light level in Lux.
Lesson 2: Setting up the Data Logger
When students look at the live data on the Data Logger, can they figure out what temperature scale is being used? Talk about the difference between Fahrenheit and Celsius scales. Explain how you can convert temperatures from one scale to another. This website offers a conversion tool and interesting interactive thermometer. It also shows the formulas to use.
Show them how to change the temperature scale, if desired, using the menu.
Set the time so that downloaded data reports the correct information.
Set the sample rate, which can range from once every second, 10 seconds, 30 seconds, or longer. For short trips that Tuff-Bot takes, a shorter sample rate is better.
Lesson Idea 3: Collecting Data
Attach the Data Logger to Tuff-Bot.
Use the menu to start logging data.
Give commands to Tuff-Bot to navigate a route that students design.
Keep a record of the commands so that the route can be repeated later.
If possible, include in the route both shady and sunny areas, so different temperatures can be recorded. Use the Pause button (with the two vertical lines), which stops Tuff-Bot for .5 seconds each time you press it. Having Tuff-Bot pause in its journey may give you more accurate temperature and brightness readings if the environment changes.
Lesson Idea 4: Looking at the Data
After the route is complete, download the data to a spreadsheet.
This video shows how to export data from the Data Logger.
Once the data is in the spreadsheet, it will look something like this:
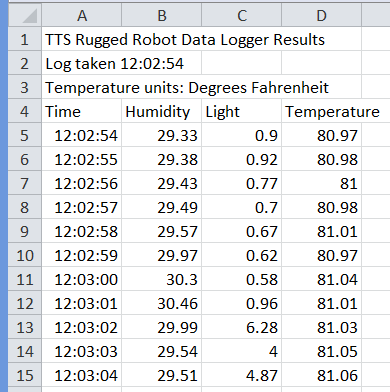
Here are some ideas for looking at the data:
- What was the highest temperature?
- What was the lowest temperature?
- When was the brightness and highest or lowest?
- How much did the humidity change?
This data was sampled every second. If you can have Tuff-Bot repeat the set of commands, students can walk through the data, moving their fingers down the rows, one row per second, to see where the data changed.